Surface & Interface Hub
Theme
XPS spectrum interpretation
XPS Tools · v0.4

XPS Spectrum Identification

Interpret XPS spectra from VAMAS files. Survey spectra can be analyzed in terms of possible elemental lines, while core-level regions can be compared with curated binding-energy literature references and reported peak assignments.

Launch Spectrum Identification → VAMAS files are processed locally in your browser.
Survey

Identify candidate elements
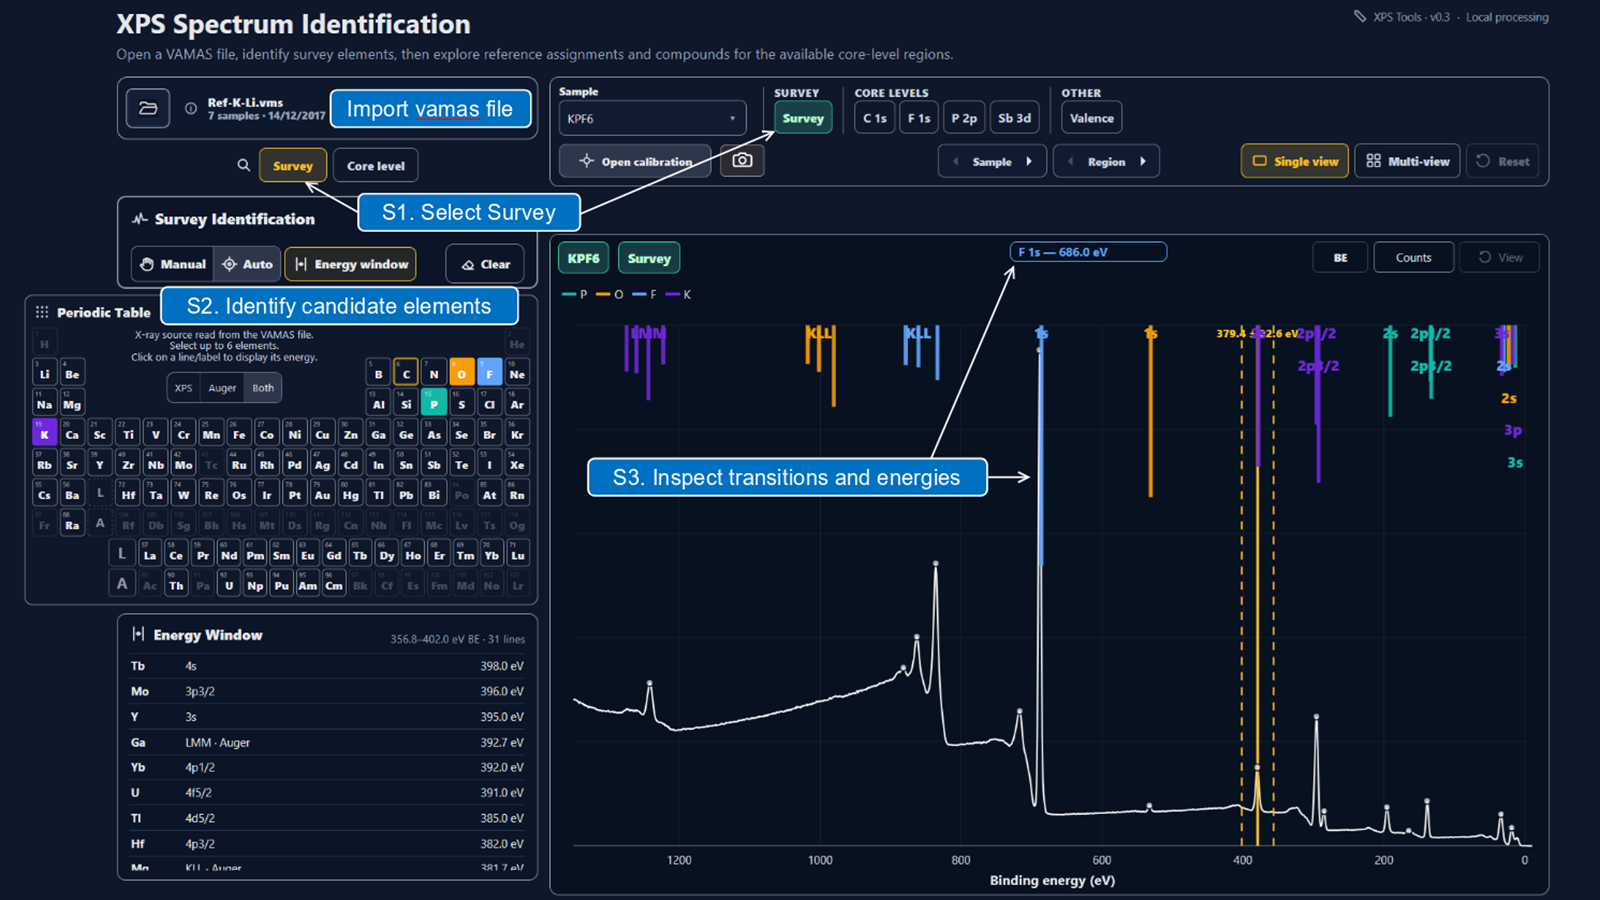
Annotated Survey identification workflow
Core levels

Compare reference assignments

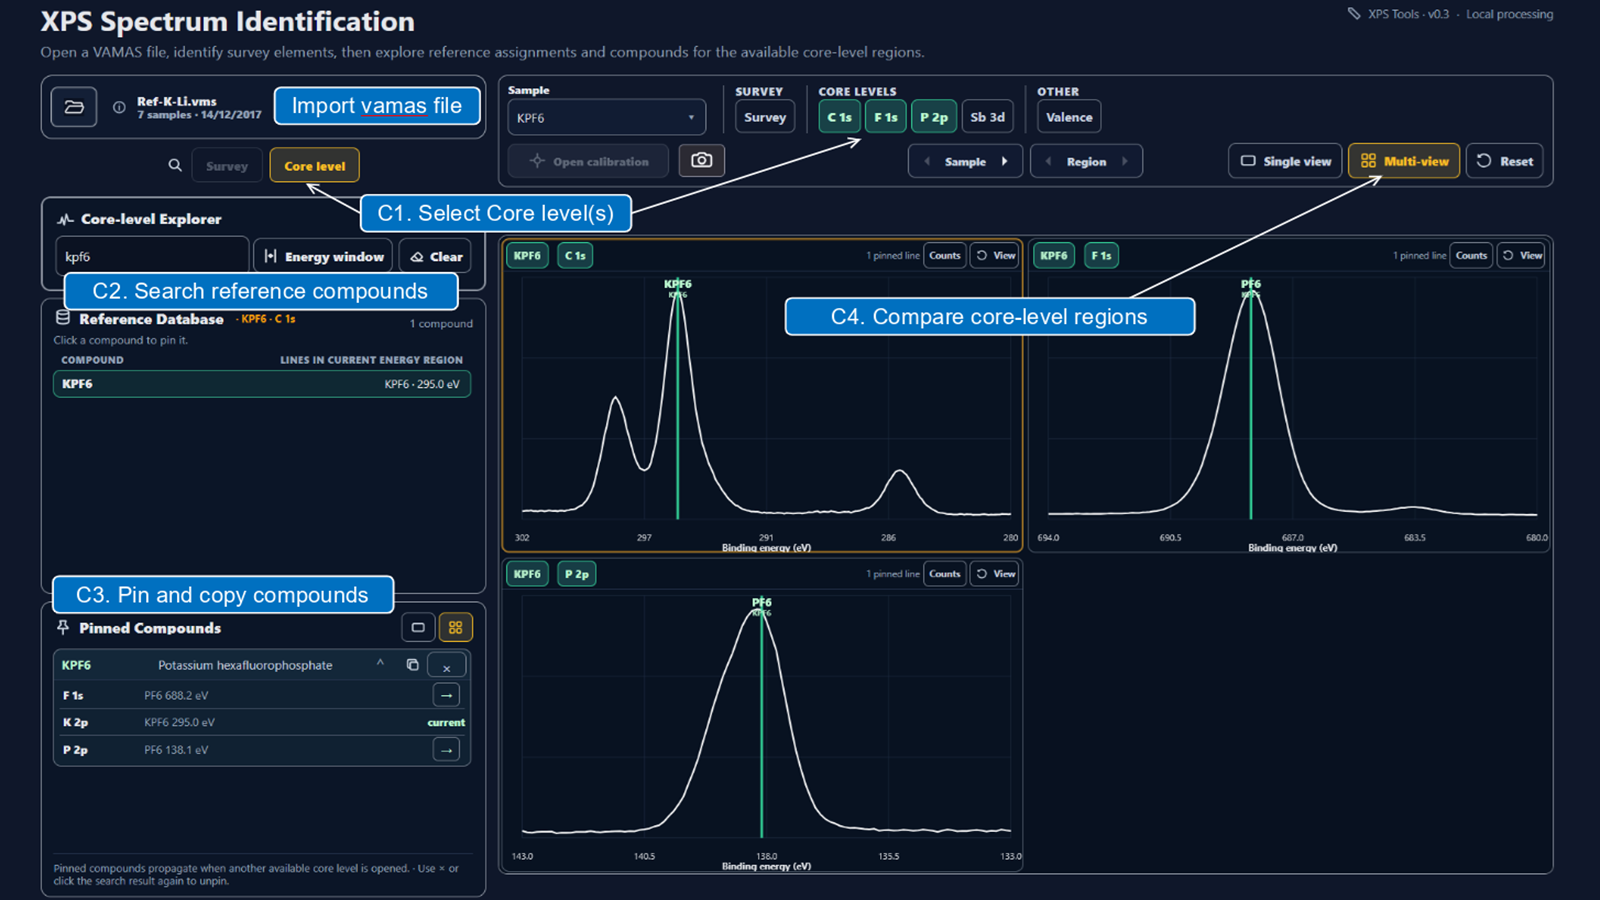
Annotated Core-level reference and comparison workflow

Interpret survey and core-level spectra

Survey spectra

  • Identify candidate elements manually, automatically or within an energy window.
  • Compare labeled XPS and Auger transitions before interpreting the spectrum.

Core-level regions

  • Search compounds by name, chemical class or functional group.
  • Pin compounds with literature binding energies and reported peak assignments.
  • Compare complementary core-level regions in single or multi-view.

Shared controls

  • Calibrate binding energies when needed without modifying the original VAMAS data.
  • Search within a selected binding-energy window.
  • Switch between single and multi-view visualization.
  • Export the current spectrum or comparison as an image.
Suggested elements and peak assignments depend on the available reference data, spectrum quality, calibration, instrumental conditions and sample chemistry. They should support interpretation, not replace critical assessment.