
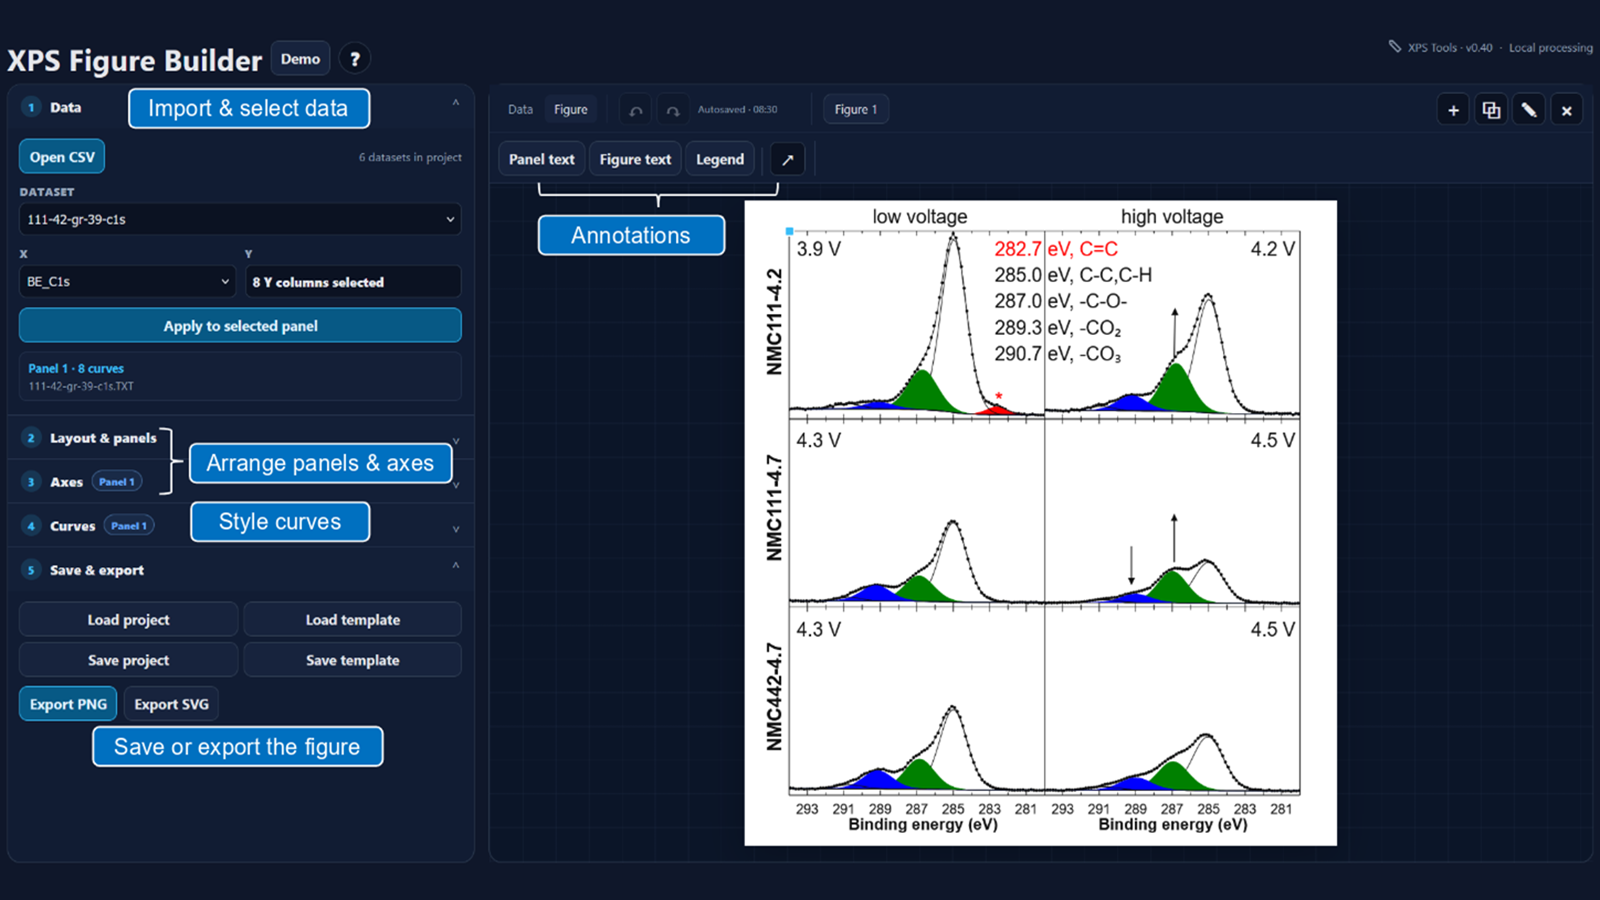
From data to figure
Import data
Open one or more CSV files and assign selected curves to a panel.
Build the layout
Arrange single or multiple panels with independent or shared axes.
Style curves
Customize line, marker and fill styles for each curve.
Add annotations
Add and position text, legends, lines and arrows.
Save and export
Use autosave, projects and reusable templates, then export as PNG or SVG.